Monday, February 13, 2017

BENJAMIN FRANKLIN & THE TWO IMPORTANT QUESTIONS

Nice read.

Here’s what Franklin’s average day looked like:

5 a.m–8 a.m. Wake up. Get cleaned up. Say hello to the good Lord above. Figure out what’s on the                       agenda for the day. Eat breakfast.
8 a.m.–12 p.m.  Work.
12 p.m.–2 p.m. Read or overlook accounts; eat lunch.
2 p.m.–5 p.m.   Work.
5 p.m.–10 p.m. Clean up. Put things away. Have dinner. Listen to music or get entertained somehow.                        Engage in conversation. Reflect on the day.
10 p.m.–5 a.m. Sleep.

Sunday, February 12, 2017

China becoming a maritime superpower ?

How China rules the waves

Beijing has spent billions expanding its ports network to secure sea lanes and establish itself as a maritime power.

Good read...How China rules the waves

What Business Models Have Float?

Most people know Warren Buffett as a stock picker but few understand his deep affinity for businesses that have float. Below, we will look at some businesses that have access to float.

Sources of float: Insurance
Berkshire Hathaway uses insurance float as one of its key sources of investable funds. It’s well known that Buffett was drawn to the business of insurance for it provided a fountain of additional investable funds. These investable funds, however, belonged to insurance policyholders, not to Buffett, as these funds are claims to be paid to policyholders. These investable funds held by Berkshire can be called float, or insurance float.

Here is some commentary that Buffett has said about insurance float from the 2014 shareholder letter:
“One reason we were attracted to the property-casualty business was its financial characteristics: P/C insurers receive premiums upfront and pay claims later. In extreme cases, such as those arising from certain workers’ compensation accidents, payments can stretch over many decades. This collect-now, pay-later model leaves P/C companies holding large sums – money we call “float” – that will eventually go to others. Meanwhile, insurers get to invest this float for their benefit. Though individual policies and claims come and go, the amount of float an insurer holds usually remains fairly stable in relation to premium volume. Consequently, as our business grows, so does our float.
— Berkshire Hathaway - 2014 Letter to Shareholders

How is insurance company float calculated? Buffett delves into the calculation for insurance float as follows in the 1994 shareholder letter as follows:
“For the table, we have compiled our float – which we generate in exceptional amounts relative to our premium volume – by adding loss reserves, loss adjustment reserves, funds held under reinsurance assumed and unearned premium reserves and then subtracting agents’ balances, prepaid acquisition costs, prepaid taxes and deferred charges applicable to assumed reinsurance.
— Berkshire Hathaway - 1994 Letter to Shareholders

So we know about insurance companies as having float, but what about other types of companies with float? By float, we mean funds belonging to others that are in transition and temporarily held by the company. There are several that come to mind.

Sources of float: Lottery
A less intuitive business with float is the lottery. Whether states know it or not, they have a source of float when millions of tickets are bought by hopeful consumers wishing to win the state-run lottery jackpot. When the state holds the proceeds until the jackpot is paid out, either in lump sum or as an annuity, the state is holding substantial funds that really don’t belong to them. This is a form of float. Given the dire financial situations of some of these states, maybe some ought to consider conservatively investing this lottery float! Alternatively, just having the money in a savings account provides a return on the float, which adds up given the millions of lottery tickets bought.

Sources of float: Gift Cards
Another form of float comes in the form of gift cards. When the retail store GAP sells its gift cards to customers, it gets paid money upfront that GAP holds until the cards are redeemed. There is an industry term called “breakage” which actually means the percentage of gift cards (value-wise) that are never redeemed. Figures of breakage of 10% are not unheard of. With 10% breakage, this means that GAP gets paid 10% to hold these funds received from the sale of their gift cards. The duration however of these gift cards, i.e. the time from the receipt of money for the gift cards until the owner of the gift cards redeems them for value can be relatively short. Such a short time period of holding this float makes it difficult for places like the GAP or Starbucks to invest these funds into securities for any meaningful period.

Sources of float: Bank
A bank has a source of float in the form of deposits from its customers that it can lend out to other customers or invest in securities to generate investment returns. Buffett liked banks so much that he owned through Berkshire a bank in Illinois until the U.S. government forced Berkshire to dispose of it – the U.S. government made Berkshire decided whether it was going to be in the insurance business or in the banking business. Buffett chose the former, disposing of the Illinois bank. This, however, did not preclude the ownership of minority positions in banks. One such minority position is Wells Fargo, which is one of the largest positions held by Berkshire’s insurance subsidiaries.

Sources of float: Loyalty Programs
Blue Chip Stamps was a company that had a varied take on gift cards and loyalty programs by selling stamps to retailers. Blue Chip Stamps would then take the proceeds from retailers and hold onto them until retailers redeemed these stamps with cash from customers. Customers would select items from a catalog and submit stamps they’ve collected from retailers to “pay” for these items. When the retailers submitted these stamps, the “float” held by Blue Chip Stamps was then returned as cash. In the meantime, while Blue Chip Stamps held this float, it was able to invest these proceeds in securities such as stocks and bonds. The stock of Blue Chip Stamps used to be a core holding of Berkshire, until Berkshire eventually acquired the company in its entirety. No doubt, Blue Chip’s access to and ability to invest the float was a key point of attraction for Buffett.

Sources of float: Traveler’s Checks
American Express, which is still a core position of Berkshire Hathaway, used to have a substantial source of float in the form of traveler’s checks. The funds from the traveler’s checks were similar to funds received in exchange for gift cards. American Express held this float until the traveler’s checks were used or redeemed by customers while travelling abroad. These days traveler’s checks are rarely used.

Sources of float: Payment Processing Business
Another business that has float, albeit in extremely short duration, is the payment processing business. You can think of companies like ADP, which temporarily hold wages and salaries for its clients before paying them out. It would be difficult to invest this float however since the holding period is so short, and it would be unethical to tell workers that they were receiving less money than they were supposed to because their wages were put into some bad investments! At the same time, ADP may still reap some return from holding these funds in its checking account.

Sources of float: Subscription Businesses & Pre-Paid Contracts
There are subscription and pre-paid contract businesses like newspapers and Netflix, while not technically receiving float belonging to customers that they have to return at some point, they are receiving payment upfront for services and products that need only be funded later down the road. In the meantime these funds could be used in flexible ways to fund buybacks, purchases of securities, etc. As long as such funds are continually coming through the door to replace old funds that are being invested, these funds can operate as a form of float by providing negative working capital. Remember, negative working capital is a form of float – if you have 90 days accounts payable while accounts receivable are one week, you, in essence, are generating excess liquidity that can be used to do all sorts of wonderful things. Perhaps this is one of the reasons why Buffett loves Coca-Cola, which he has said on more than one occasion has negative working capital.

Friday, February 3, 2017

Chua Soon Hock

Read a finance blogger post talking about this 'super-investor'... thought I penned it here to remind myself...


LESSONS FROM A SUPER INVESTOR – A PERSONAL FRIEND OF TTI


Quick Poll: Don’t google this, but who here has heard of Mr Chua Soon Hock?Yup. I thought so. Nobody.

Probably not a single one of the 1000+ or so people who will read this post, knows who this guy is. Not now anyway.
He is a personal friend of TTI, and is the most low profile and under-rated super investor I know. (He doesn’t know me as TTI, and neither does he have any knowledge of this post at the time of writing this.)
Track Record
Before I start, of course I gotta justify what I mean by “super investor”. That’s easy enough. I’ll let his track record speak for himself. If this doesn’t qualify as a super investor, I don’t know what does.
Now, I haven’t gotten permission to write this post, so everything I write here will pretty much have to come from public information. Nothing personal will be revealed.
CSH started his career in GIC, before moving to Sanwa Bank, where he rose to become the chief strategist (aka CIO). He left and eventually, in 1st March 2000, he launched his Japan Macro Fund, managed under Asia Genesis Asset Management, which today, has become his private investment vehicle.
By 2009, he closed the fund and returned all funds to investors, citing health reasons:
http://singaporehedgefund.com/?p=425

The fund’s performance?

In the 9 years of the fund’s existence, it generated a return of 18.89% annually! In fact, as the fund grew, the performance actually improved (larger fund sizes are usually a drag on performance, but not in this case). From Jan 2003 to 2009, the fund generated an annualized return of 26.02%!
http://www.opalesque.com/54076/Asia_Chua_Soon_Hock_announces_retirement076.html

Even the 2nd newer fund, Asia Genesis Equity Fund, launched in May 2009, returned net 8.92% as at end July 2009. That’s 8.92% in 3 months!

Annunalized return of 18.89% means that if you had invested $1mil at the start of the fund, it’d have grown almost 5-fold to $4.8mil by 2009 when the fund was closed. (I was told that the return would be even higher when converted into SGD terms)

Even in the midst of poor performance amongst all peers, the fund stood out for its resilience:

http://www.institutionalinvestor.com/article/2025742/Article/3255118/Banking-and-Capital-Markets-Banking/Asian-Fund-Managers-Counter-Volatility-by-Focusing-on-Long-Term.html#.WJILz_l97IU

Now, all these results obviously made CSH a well respected figure in the fund management business. He was recently sought out by TheEdge for his opinions in several opinion pieces.

On top of that, CSH recently made the news (reluctantly I’m sure) when he splashed out the cash to buy some GCBs to capitalize on a”unique situation”. The jury is still out on the success of this investment, but given time….

Come on, I’m sure anyone by now will agree that this guy is an investing monster.

http://www.straitstimes.com/business/property/fatal-row-2-houses-of-victim-sold

I’ve stated multiple times in SG TTI that Global Macro investing is something that confuses me. There are so many variables to consider and each inaccuracy in your thought process can snowball and affect your conclusions in unimaginable ways. Yet this friend of mine, does it consistently, with amazing results.

Even now, managing his vast personal fortune, his returns continue to be astounding. It’s just no longer published and the world doesn’t know what he does (Aside from the occasional news report like the GCB acquisition above)

Now, CSH doesn’t know me as TTI. He knows me as a doctor. Of course, in our social conversations, he knows this other side of me where I pit my investing skills against the world. Occasionally, (I think), he gets bemused and surprised at why this clinician knows so much about investing.
Well, we all need a hobby.

Alright, so there are 2 lessons that I can draw here:
Humility. When was the last time you felt like a king when you got a 20% ROI on your investment? Well, there are guys out there who get that consistently, year in, year out.
I’m constantly reminded that there are titans in this space. And this titan, doesn’t even want to let people know he’s a titan.
Each time I think my research is so water tight, and that I know everything there is to know about a company, I’m reminded that there are others who are sharper, smarter and work harder than me at this.
What do I know that they don’t?
This drives me to go on and on and on. I’ll dig deeper, work harder, think on a different level altogether and do what others won’t do or find it too tough such that they give up.
And ultimately, even if an investment turns out to be a multi bagger killer… just remember that there’s no room for arrogance. Arrogance/complacency dulls your sense of urgency and makes you settle.
(There’s another lesson about work ethic but I won’t talk about it here)
Expected Returns. The other lesson I gather, is the range of expected returns. Now, if in your personal investing journey, you consistently get sky high returns of >15% year in year out… logically, it must be 1 of 5 scenarios:
  1. Your calculation methodology is wrong. Systematic error.
  2. You’re trying to con yourself. Or others too.
  3. Your portfolio size is puny enough. And even then, you need to add an enormous dose of luck to it.
  4. You are an investing genius. Congrats.
  5. You are doing illegal stuff. Transporting firearms, drugs or stuff like that.
Yup. Those are the only ways one can get to boast of sky high returns CONSISTENTLY. For most of us at least.
Which is also why I am highly skeptical when people show up with long term, multi year returns of 20+%. Or 30%. Or 40%. It just cannot happen. Everyone likes to think that they’re a Carl Icahn.
Even for CSH to achieve this level of success, his work ethic (when he was managing other people’s funds) was out of this world. The level of hard work that goes on behind the scenes is always unnoticed. Only the fancy results.
Most people are just not prepared to go to that extent… yet expect to get the same results.
I’ll divert a bit here. My personal hypothesis for this phenomenon of ever rising ROI figures, is simply that today, there is so much competition for attention. Financial coaches running courses, financial bloggers (yes, I guess that includes SG TTI), and even publications like TheEdge, occasionally show their returns.
10% used to be impressive. Not so though, if everyone else shows 15% ROI right? Then how about 20%?
And it goes on and on.
Well, take it all with a pinch of salt. Cos now we know: 18.9% annualized over 9 years, is enough to put you at the apex of the investing world. Period.

Anyway, in the spirit of sharing, I’ll share an article written by CSH way back in 1999 (!!!), shared with me. I think most investors would do well to read, understand, internalize and execute.
Execution, is going to be by far, the hardest part.
PLAYING THE STOCKMARKET: WHAT EVERY RETAIL INVESTOR SHOULD KNOW
The purpose of this article is to address the recurring phenomenon of retail investors losing money in the financial markets and to provide a roadmap for realistic and profitable investing for non-professional investors.
The points below are meant for non-leveraged retail investors and not for institutional and leveraged speculators. Although the general philosophy in investing is applicable to all classes of players, the strategies and methods will differ for different players. The pointers below of course are not comprehensive but are to the best of my knowledge as a market practitioner.
Before we begin, let us consider: Why do retail investors lose money?
The reasons normally fall into one or a combination of the following:
  • Investors buy shares at relatively high prices and sell them at lower prices.
  • Active trading results in high commissions, where costs become a big factor.
  • Investors hold shares bought at high prices during euphoric, bull period with big unrealized losses and take small profits from other shares purchased.
  • Investors buy ‘in-fashion funds’ promoted by financial institutions during a particular time window. This is despite the good past performance of the funds.
Underlying factors that cause the above-mentioned tendencies:
  1. Not knowing who you are in relation to the marketplace
  2. Not knowing what the marketplace is about
  3. Not understanding the basic human weaknesses of greed, fear, impatience, pride and laziness
  4. Listening to the counsel of those who do not have the skill-sets to help you make money.
  5. Not applying common sense but being confused by endless emphasis on unprofitable semantics of what are blue chips and what are not, what is investing and what is speculating, what is safe and what is not.
Rule 1: Know who you are in relation to the marketplace
Successful investing starts with knowing your limitations and strengths.
The limitations which affect most retail investors are:
  • Time: the limited time available to track and learn the markets without affecting other responsibilities adversely
  • Resources: the limited financial resources that most can hardly afford to lose without jeopardizing the fulfillment of family responsibilities
  • Knowledge: the little knowledge and ignorance of the intricacies of products and the dynamics of the markets
  • Cost: the highest per unit cost of transaction among all players
The strengths of retail investors are:
  • Investing is not your job, therefore you are under no compulsion to trade
  • You can afford to wait
  • You need not be leveraged
  • Your trades will not affect market prices, therefore there is no slippage in execution
Honesty is required to arrive at this understanding and to come to accept your strengths and weaknesses. The key is to focus on minimizing the adverse effects of your limitations and exploiting your strengths to your advantage. Devising an investment strategy along this line is essential. A good fisherman must first know that he is a fisherman; his job is to catch fish and not be the fish.
But knowing this, though important, is not enough; you must also realistically know what type of successful fisherman you are or can be, and concentrate on being that type of fisherman till you attain proficiency. Practice makes perfect.
The retail investor cannot be a successful ‘Goldman Sachs’ and apply the methods of an institutional player. You should concentrate on being ‘that profitable retail investor’. With this clear self-identity you can then cut out 95% of investment literature which though at times sounds logical, realistically is not applicable to your situation. This will thus eliminate confusion and result in clear thinking and improve your ability to focus on learning what matters. The learning costs involved in perfecting the art of investing, within the science of probability can then be kept to a minimal.
Rule2: Know what the marketplace is about
The marketplace should be seen as mass human forces of buying and selling that result in various prices over a period of time on a continuous basis. At a certain point in time buying forces will dominate, while at other times selling forces will be dominant. The market trades on float and not on a total basis.
This fundamental understanding is needed to comprehend the underlying psychological behavior of extreme movements that frequently occur in markets over time. A hard look at financial markets should make one come to the conclusion that “markets are the biggest re-distribution of wealth mechanism invented by the capitalists.”
This realization should lead to two conclusions and raise the antennae of care and caution. One, that participation in markets necessarily means that if I don’t make money, I will be losing my money to someone else. And two, if I want to win then I have to learn to apply an appropriate strategy that incorporates the right philosophy, principles and methods that suit my situation, from people who have done it successfully and consistently before as retail investors.
Rule 3: Identify the basic human weaknesses
How do human weaknesses empty your pockets? If one initially makes money, greed usually makes him gradually increase his positions until his biggest holdings are always at, or near, the top of the market in the intermediate or long term. When the correction or crash comes, due to heavy exposure, there is a necessity to cut positions at dramatically low prices resulting in big losses.
Fear makes one miss investing in the market when shares are at bargain basement levels. Fear always is the major hindrance to exploiting good opportunities.
Impatience leads one to invest when good opportunities have not arrived, thus committing resources in a unproductive manner and finding oneself in a ‘no-bullet’ situation when the opportunities finally come.
Pride makes one hold to unprofitable beliefs, prejudices and behavior, cutting a person off from learning and adjusting to truth and realities. Pride is so expensive that no one can afford it.
Laziness makes one stick to shortcuts in life, but the truth is that there are none. One always reaps what one sow. If one applies sound investing philosophy, principles and methods appropriate to one’s station, he has to reap profits. There is no other way. But if one sows wrong counsel and applies unsound philosophy, principles and methods, one must surely reap the pain of an empty pocket in due time.
Identification of all these common and normal human weaknesses and their adverse effects on the pocket is essential if one aims to be a consistently profitable retail investor. One needs to prepare oneself psychologically to overcome these human weaknesses when markets move to a certain situation that puts one to the test. And in order to come out on top, there is a need to ‘dehumanize yourself’ and institute a certain systematic methodology, through the basic of ‘knowing yourself and knowing the marketplace.’ This is the basic principle of successful engagement.
Rule 4: Garbage in, garbage out: Know the quality of your counsel
Too often investors concentrate on their desire to get rich without paying detailed attention to the process and to working on the process that is suitable to him. The truth is that if you get the process right and work on it, the desired results will be the natural consequence, in due time. Therefore the quality of your counsel to help you to arrive at the process is important.
However, one of the most common mistakes among retail investors is to rely on their brokers to help them make money. But really, if they can help you make money they would most likely not be your brokers. A broker ‘brokes’. It is unrealistic and not reasonable to expect your well-intentioned brokers to have the skills to help you make money. They are there to help you execute your trades. The few exceptional brokers with some moneymaking skills will be covering the rich and powerful.
Retail investors also rely too heavily on tips. But can a good insider tip get to a small retail investor and be of relevance? This is almost impossible. Even assuming that the tip is reliable, by the time it reaches the ‘small potatoes’, in all likelihood the big “sharks” would already be waiting to take profit on this new batch of buyers.
The underlying reason for the existence of ‘rumours and tips’ in the marketplace is mainly because a player or group of players has an inherent position in the market and want to influence prices in order for them to profit from the impact of this news. This is a silly and ultimately painful way for retail investors to engage in the market.
Retail investors also tend to rely on the publications of reputed, established financial institutions to make investing decisions. However, there is no positive correlation between the profitability and reputation of a financial institution and the relevance of its research in helping retail investors making money.
An investor rely on the past good performance of a stock fund to invest without examining the following points: Firstly, did the dedicated fund have outstanding results due to the mere fact that that particular sector or country had a huge rally? Secondly, was the past good performance due to the same time window of the bull market phase?
There is a need to seek highly skilled fund managers who consistently outperform the market, and invest in these funds. However, the truth is that in most cases these seasoned veterans have already more than enough money to manage. Retail investors are therefore likely to be left with fund managers from institutions that are still in the ‘experimenting process’.
Good fund managers are individuals who are identifiable; they are not institutions. Successful investing is a personalized skill. Most institutions are profitable because they are very good at marketing.
Rule 5: Apply common sense
Between the individual and the market, one is controllable while the other is not. Therefore investors should focus on improving the controllable “self” to enhance their chance of success in the uncontrollable market. Most however focus on trying to guess the direction of the market, thus neglecting to focus on controlling weaknesses of “self” as highlighted earlier.
In my experience as a practitioner, when one focuses on time, size and price management coupled with patience the probability of success is very high. Big price fluctuations should be viewed as opportunity rather than with fear. It is exactly because of these big price fluctuations over a long period that one is able to buy at depressed prices and sell at high prices. To be truly profitable consistently one must be able to buy at low prices consistently. In the long run only those who manage to “buy low and sell high” will be the winners.
Frequently Asked Questions
Q: what is the appropriate strategy for retail investors?
A: As a general rule, there are two points to consider. Firstly, the strategy must not rely on having an edge in resources of time, knowledge and finance, as retail investors are weakest in these areas when compared to all other players. Secondly, such a strategy must necessarily be based on the patience to buy shares at basement prices on a non-leveraged basis with minimal transactions over an extended period.
Q: How can retail investors know when shares are at basement prices?
A: Shares will be at basement prices when bearish psychology is extreme and liquidity is tight in the following situations:
  • The asset bubble bursts and strong economy tailspins into a recession like the recent Asian crisis
  • The economy goes into a period of stagflation
  • The economy in a depression with prevailing banking crisis
  • The market crashes due to special events eg Gulf War, 19 Oct 87 (program trading), LTCM debacle, etc
Q: How do I improve my timing in order to buy shares at basement prices?
A: For situations where share prices are low due to a weaker economic cycle it is best to invest over a six to 12 month period. The initial investment should be 50% of capital, with 10% each subsequently over the intended period for the last 50%. The timing of the initial investment of 50% is crucial.
Based on my experience it is best to buy on the day following the national government’s admission that the economy is in a recession and gives a negative GDP forecast for the rest of the year. When this announcement is one that makes the front page of the national daily, then almost all the bad news has been discounted by the market.
For a market crash due to a special event it is normally right to commit 50% of capital on the same day of the event and the rest of the 50% within a week. Special event crash tends to be immediate and furious as institutional and retail investors all unload holdings aggressively yet simultaneously, thereby prices reach bottom very quickly.
In the case of a banking crisis, the time to buy is when the government’s plan to use public money to re-capitalize the banks, whether directly or indirectly through tax incentives aimed at the disposal of bad loans, is at the final stage.
Q: What type of shares should one buy?
A: Buy the top two of the best-managed institutions from each of the key sectors of banking, media, telecommunications, healthcare and computer software. These sectors tend to be essential and also have inherent oligopoly power.
Q: Is the investing going to be smooth sailing?
A: Absolutely not, especially at the initial phase of your buying spree. All your good friends including your dear spouse will think that you are crazy. They will say, “The market is getting lower, this is too dangerous, you can wait”. And likely, in the next few days or weeks after buying, the market may indeed go lower, and you will look like a fool.
But to want to buy at the absolute bottom is not possible. But to buy near the bottom is possible and can be made highly probable by this approach. Be prepared for some short-term psychological torture. But you need to buy. If not, you will watch and miss the opportunity altogether. Somehow in most cases, you will later look like the wisest man in town for having the courage to buy those shares. View it as short term pain, long term gain.
Q: When then should one take profits?
A: For shares bought resulting from a market crash due to special events (ie it is a one-off situation), one can take profits when profits are between 50% to 100% within a six months period.
However, for shares bought as a result of an economic crisis or economic downturn one should keep them for years. Liquidation should only begin when the bull market is so obvious and in such a great rage that it sucks in all kinds of new retail players. The greater fool theory, unfortunately, always comes into play near the end of a new bull market cycle. Shares should be disposed gradually over a 24-month period as bull markets normally last much longer than expected.
Q: After taking profits, what should the investor do with the money?
A: Stay in cash until shares are at basement prices again. This strategy implies that when not invested one must hold cash and be patient even if the waiting period is long. In fact, one of the unprofitable “myths” that is frequently encouraged and practiced is that of continued deployment of capital to enhance returns.
This approach usually means that when the opportunity comes for acquiring bargain basement shares you will not have the money. Instead you will be among those hurt by lower share prices. Rather, you should build up liquidity for deployment when market liquidity is tightest in order to make big money.
Q: How often can a retail investor reasonably be expected to participate in such an investment strategy?
A: Assuming a 35-year investment life, one can expect to participate in three to four complete economic cycles, with each cycle of about eight to 10 years, yielding returns of at least 200% over capital. With this approach, transaction costs will be at the barest minimum and any disruption to one’s job will be almost non-existent, as the investor will be doing nothing most of the time.
During this period of 35 years, one who is patient and courageous will in addition be rewarded withabout five event market crashes, which should yield at least 50% for each event. Therefore this strategy though on a day to day basis does not seem to bear anything, can be very profitable and consistent over the 35 years horizon.
Be patient and be prepared, and you will come out tops in the investment arena.

Sunday, January 22, 2017

How Warren Buffett Interprets the Income Statement

When it comes to analyzing the income statement, it is important to investigate further and drill down to detect what the quality of earnings are made up of and what the numbers interpret.

Gross Profit Margin: firms with excellent long term economics tend to have consistently higher margins

Durable competitive advantage creates a high margin because of the freedom to price in excess of cost
Greater than 40% = Durable competitive advantage
Less than 40% = competition eroding margins
Less than 20% = no sustainable competitive advantage
Consistency is key
Sales Goods and Administration: Consistency is key.

Companies with no durable competitive advantage show wild variation in SG&A as % of gross profit

Less than 30% is fantastic
Nearing 100% is in highly competitive industry
R&D: if competitive advantage is created by a patent or tech advantage, at some point it will disappear.

High R&D usually dictates high SG&A which threatens the competitive advantage
Depreciation: Using EBITDA as a measure of cash flow is very misleading

Companies with durable competitive advantages tend to have lower depreciation costs as a % of gross profit
Interest Expenses: Companies with high interest expenses relative to operating income tend to be either:

1) in a fiercely competitive industry where large capital expenditure required to stay competitive

2) a company with excellent business economics that acquired debt in leveraged buyout

Companies with durable competitive advantages often carry little or no interest expense.
Warren’s favorites in the consumer products category all have less than 15% of operating income.
Interest expenses varies widely between industries.
Interest ratios can be very informative of level of economic danger.
Important: In any industry, the company with the lowest ratio of interest to Operating Income is usually the one with the competitive advantage.

Net Earnings

Look for consistency and upward long term trend.
Because of share repurchase it is possible for net earnings trend to differ from EPS trend.
Preferred over EPS
Durable competitive advantage companies report higher % net earnings to total revenues.
Important: If a company is showing net earnings history greater than 20% on total revenues, it is probably benefiting from a long term competitive advantage.

If net earnings is less than 10%, likely to be in a highly competitive business
How Warren Buffett Interprets the Balance Sheet

Cash and Equivalents:

A high number means either:

1) The company has competitive advantage generating lots of cash

2) Just sold a business or bonds (not necessarily good)

A low stockpile of cash usually means poor to mediocre economics.

There are 3 ways to create large cash reserve.

1) Sell new bonds or equity to public

2) Sell business or asset

3) It has an ongoing business generating more cash than it burns (usually means durable competitive advantage)

When a company is suffering a short term problem, Buffett looks at cash or marketable securities to see whether it has the financial strength to ride it out.

Important: Lots of cash and marketable securities + little debt = good chance that the business will sail on through tough times.

Test to see what is creating cash by looking at past 7 yrs of balance sheets. This will reveal how the cash was created.
Inventory

Manufacturers with durable competitive advantages have the advantage that the products they sell do not change, and therefore will never become obsolete. Buffett likes this advantage.
When identifying manufacturers with durable competitive advantage, look for inventory and net earnings that rise correspondingly. This indicates that the company is finding profitable ways to increase sales which called for an increase in inventory.
Manufacturers with inventories that spike up and down are indicative of competitive industries subject to boom and bust.
Net Receivables

Net receivables tells us a great deal about the different competitors in the same industry. In competitive industries, some attempt to gain advantage by offering better credit terms, causing increase in sales and receivables.

If company consistently shows lower % Net receivables to gross sales than competitors, then it usually has some kind of competitive advantage which requires further digging.

Property, Plant & Equipment

A company with durable competitive advantage doesn’t need to constantly upgrade its equipment to stay competitive. The company replaces when it wears out. On the other hand, a company without any advantages must replace to keep pace.

Difference between a company with a moat and one without is that the company with the competitive advantage finances new equipment through internal cash flows, whereas the no advantage company requires debt to finance.

Producing a consistent product that doesn’t change equates to consistent profits. There is no need to upgrade plants which frees up cash for other ventures. Think Coca Cola, Johnson & Johnson etc.

Goodwill

Whenever you see an increase in goodwill over a number of years, you can assume it’s because the company is out buying other businesses above book value. GOOD if buying businesses with durable competitive advantage.

If goodwill stays the same, the company when acquiring other companies is either paying less than book value or not acquiring. Businesses with moats never sell for less than book value.

Intangible Assets

Intangibles acquired are on balance sheet at fair value.
Internally developed brand names (Coke, Wrigleys, Band-Aid) however are not reflected on the balance sheet.
One of the reasons competitive advantage power can remain hidden for so long.
Total Assets & Return on Total Assets

Measure efficiency using ROA
Capital is barrier to entry. One of things that make a competitive advantage durable is the cost of assets needed to get in. This is why we calculate the Asset Reproduction Value along with the EPV.
Many analysts argue the higher return the better. Buffett states that really high ROA may indicate vulnerability in the durability of the competitive advantage.
E.g. Raising $43b to take on KO is impossible, but $1.7b to take on Moody’s is. Although Moody’s ROA and underlying economics is far superior to Coca Cola, the durability is far weaker because of lower entry cost.

Current Liabilities
Includes accounts payable, accrued expenses, other current liabilities and short term debt.

Stay away from companies that ‘roll over the debt’ e.g. Bear Stearns
When investing in financial institutions, Buffett shies from those who are bigger borrowers of short term than long term debt.

His favorite ‘Wells Fargo’ has 57 cents short term debt for every dollar of long term
Aggressive banks (like Bank of America) has $2.09 short term for every dollar long term
Durability equates to the stability of being conservative.

Long Term Debt coming Due

Some companies lump their yearly long term debt due with short term debt on the balance sheet. This makes it seem like there is more short term debt than the real amount.

Important: Companies with durable comparable advantages need little or no LT debt to maintain operations.

Too much debt coming due in a single year spooks investors and can offer attractive entry points.

However, a mediocre company in problems with too much debt due leads to cash flow problems and certain bankruptcy.

Long Term Debt

Buffett says that durable competitive advantages carry little to no LT debt because the company is so profitable that even expansions or acquisitions are self financed.

We are interested in long term debt load for the last ten years. If the ten yrs of operation show little to no long term debt, then the company has some kind of strong competitive advantage.

Buffett’s historic purchases indicate that on any given year, the company should have sufficient yearly net earnings to pay all long term within 3 or 4 year earnings period. (e.g. Coke + Moody’s = 1yr)

Companies with enough earning power to pay long term debt in less than 3 or 4 years is a good candidate in our search for long term competitive advantage.

BUT, these companies are targets for leveraged buy outs, which saddles the business with long term debt
If all else indicates the company has a moat, but it has ton of debt, a leveraged buyout may have created the debt. In these cases the company’s bonds offer the better bet, in that the company’s earnings power is focused on paying off the debt and not growth.
Important: little or no long term debt often means a Good Long Term Bet

Total Liabilities & Debt to Shareholders Equity Ratio

Debt to shareholders equity ratio helps identify whether the company uses debt or equity (includes retained earnings) to finance operations.
Company with a moat uses earning power and should show higher levels of equity and lower level of liabilities.
Debt to Shareholders Equity Ratio : Total Liabilities / Shareholders Equity
Problem with using as identifier is that economics of companies with durable competitive advantages are so great they don’t need large amount of equity or retained earnings on the balance sheet to get the job done.
Important: if the Treasury Share Adjusted Debt to Shareholder Equity Ratio is less than 0.8, the company has a durable competitive advantage.

Retained Earnings: Buffett’s Secret

One of the most important indicators of durable competitive advantage. Net earnings can be paid out as dividends, used to buy back shares or retained for growth.

If the company loses more than it has accumulated, retained earnings is negative.

If a company isn’t adding to its retained earnings, it isn’t growing its net worth.
Rate of growth of retained earnings is good indicator whether it’s benefiting from a competitive advantage.
Microsoft is negative because it chose to buyback stock and pay dividends
The more earnings retained, the faster it grows and increases growth rate for future earnings.
Treasury Stock

Carried on the balance sheet as a negative value because it represents a reduction in shareholders equity.
Companies with moats have free cash, so treasury shares are hallmark of durable competitive advantages.

When shares are bought back and held as treasury stock, it is effectively decreasing the company equity. This increases return on shareholders equity.
High return is a sign of competitive advantage. It’s good to know if it’s generated by financial engineering or exceptional business economics or combination.
To see which is which, convert negative value of treasury shares into a positive and add it to shareholders equity. Then divide net earnings by new shareholders equity. This will give the return on equity minus effects of window dressing.

Important: presence of treasury shares and a history of buyback are good indicators that company has competitive advantage

How Warren Buffett Interprets the Cash Flow Statement

Capital Expenditures

Never invest in telephone companies because of big capital outlays

Important: company with durable competitive advantage uses a smaller portion of earnings for capital expenditure for continuing operations than those without.

To compare capex to net earnings, add up total capex for ten-yr period and compare with total net earnings over the same period

Important: if historically using less than 50%, then good place to look for durable competitive advantage. If less than 25%, probably has a competitive advantage.


Thursday, January 19, 2017

One Of The Only Ways To Get Really, Really Rich

Want to be remarkably successful? Want to get really rich? (While there are many ways to feel "rich," in this case we're talking about monetary wealth.) Then check out this little gem of an investment opportunity.

It's a simple investment. You only have to invest almost all of your money. On the upside, after a year you might earn 3 percent more. The downside? Any day you could lose it all, for reasons usually outside your control and that you will almost never see coming.

Would you make that investment? Of course not.

Yet millions of people do — every day they go to work for someone else.

Of course the analogy isn't perfect. Until you're laid off or fired you do earn a salary. But when you work for someone else, your upside is always capped — sure, you might occasionally get a raise, but in most cases 3 to 4 percent is the best you can expect.

Yet your downside is always unlimited because getting fired or laid off can make your income disappear overnight — and with it the considerable investments you've made in time, effort, dedication, and sacrifice.

Extremely limited upside. Unlimited downside.

That's a terrible investment.

Rich in Wealth
So if you hope to get really rich, working for someone else will never get you there. But don't just take my word for it, the government agrees.

The IRS Statistics of Income Division, a place where fun surely goes to die, has published "400 Individual Tax Returns Reporting the Largest Adjusted Gross Incomes Each Year, 1992-2009," or in non government-speak, "400 People Who Earned a Freaking Boatload of Money."

In 2009, it took $77.4 million in adjusted gross income to crack the top 400. (That just barely got you in; the average income of everyone on the list was $202.4 million.)

Where it gets interesting is how the top 400 made their money:

Wages and salaries: 8.6 percent
Interest: 6.6 percent
Dividends: 13 percent
Partnerships and corporations: 19.9 percent
Capital gains: 45.8 percent
A few conclusions are obvious:

Working for a salary won't make you really rich.
Making only safe "income" investments won't make you really rich.
Investing only in stock of large companies won't make you really rich.
Owning a business or businesses could not only build a solid foundation of wealth but could someday...
Generate a huge financial windfall — and make you really rich.
Don't trust the IRS? Fine. Check out the top 10 on the Forbes billionaires list. Gates. Buffett. Ellison. Koch. Walton. Adelson. All entrepreneurs. (I worked my way down into the 200s and still couldn't find an employee, so I got bored and stopped looking.)

Clearly getting really rich in financial terms is the result of investing in yourself and others, of taking risks, of doing hundreds of small things right...and then doing one or two big things really right.

But what if you don't get one or two big things really right? There's another way to get really rich.

Rich in Life
I've spoken to hundreds of entrepreneurs, and each and every one does the same thing. When we talk about the financial side of being an entrepreneur — exit strategies, revenues, IPOs, cashing out — they're interested but far from animated.

But when we talk about the life of an entrepreneur, about how it feels to be an entrepreneur, they all light up. They start to gush about the challenges, the responsibility, the sense of mission, the sense of purpose, the sense of fulfillment and excitement of working with and for a real team, the amazing feelings of empowerment and the control over their own destinies....

It happens every time.

The bootstrappers with infinite dreams and negligible revenues light up.

The successful entrepreneurs such as Joel Gascoigne, who helped expand Buffer from a personal project into a business with a talented team with real revenues, light up.

The hugely successful entrepreneurs such as Scott Dorsey, who helped steer ExactTarget out of a garage, into an IPO, and then into an acquisition by SalesForce.com, light up.

Every entrepreneur lights up when we talk about being an entrepreneur because they feelalive: free to chart their own courses, to make their own decisions, to make their own mistakes — to let the sky be the limit not just financially but also (and almost always more importantly) personally, too.

And in that way, regardless of financial return, they feel really rich. And they are really rich — regardless of income or wealth.

Really, Really Rich
That's why the only way to become really rich financially and really rich personally — in other words really, really rich — is to start your own business. Even if it's just on the side. Even if it's just a slightly stepped-up hobby.

There's no reason not to. You don't have to quit your job right away; in fact, you probably shouldn't. (One of the best ways to minimize your risk is to keep your full-time job while you build your foundation for success.) Plus the basics of starting a business are easy; you can do it in one day.

Here's the deal.
In return for less freedom, less control, and less fulfillment, every day you go to work for someone else your upside is always capped and your downside is always unlimited.

The downside for entrepreneurs is also unlimited — but in return, they enjoy the possibility of an unlimited financial upside and an unlimited personal upside.

Take a chance on yourself. Try to get really, really rich. Maybe you'll only become really rich.

One out of two is still awesome — and you will have achieved it on your terms.

If your friends and family think you were crazy for starting a business, show them this article. If you've been thinking about starting a business and people say you're being foolish, show them this article.

If the people around you don't understand how personally fulfilling taking a chance on yourself can be, have them check this out.

And then get started on your entrepreneurial journey, even in the smallest and safest way. Every step you take will bring you closer to becoming at the very least really rich — and maybe, just maybe, really, really rich — and will let you join a group of people who live their lives their way, on their own terms.

Who are those people?

Entrepreneurs. Be one.

It's the best investment you can make — because it means you're investing in yourself.

The Best Alternative to the Flawed P/E Ratio

Investors have clung to the price-to-earnings (P/E) ratio for more than seven decades. It's a simple way to get a sense of how a company's market value compares to its earnings. But there's a pretty significant problem with P/E.

Neither the "P" nor the "E" is an especially accurate gauge.

As I'll illustrate, a company's stock price is not a wholly accurate gauge of a company's value in the real world. And earnings, as we learned in the Enron/Worldcom era, can be easily manipulated.

Instead, if you want to really get a sense of a company's value relative to other firms, you should familiarize yourself with its enterprise value (EV) and EBITDA.  

A Flawed Metric
It's pretty easy to see why market capitalization (stock price multiplied by the number of shares outstanding) is a flawed metric. Let's look at two companies that both have a market capitalization of $500 million ($10 stock price multiplied by 50 million shares outstanding) and $50 million in profits. The first company has $100 million in cash while the other carries $100 million in debt. Surely you'd prefer that cash rich company, all other things being equal.
And that's where EV comes in. You simply add the firm's debt to its market capitalization and then subtract its cash in order to get to enterprise value.
Enterprise Value = Market Capitalization + Debt - Cash

In this instance, the company with all that cash is more inexpensively valued ($500 million + $0 - $100 million = $400 million) compared to the debt-laden firm ($500 million + $100 million - $0 = $600 million).

In a similar vein, it's incredibly important to assess the impact that debts and cash balances have on profits. You can figure out what profits look like before interest expense (on that debt) and interest income (on that cash) by using EBITDA (earnings before interest, taxes, depreciation and amortization). In the example above, let's go on to assume both companies have $50 million in profits, but EBITDA of $60 million. [Learn how to calculate EBITDA and see an example.]

In this instance, the company with an EV of $400 million and EBITDA of $60 million has an EV/EBITDA ratio of about 6.7 ($400 million/$60 million = 6.7). The other company, the one with all the debt, has an EV/EBITDA ratio of 10 ($600 million/$60 million = 10). Just like the P/E ratio, a lower EV/EBITDA ratio is always more appealing (more company for your dollar). But unlike the P/E ratio, the EV/EBITDA ratio is difficult to manipulate.

Real World Example in the Oil and Gas Industry
Investors often use this formula when looking at firms with a high degree of depreciation or high levels of debt. EV/EBITDA is especially useful when looking at oil and gas drillers. EBITDA works best because reported earnings can become very distorted by accounting rules as oil and gas wells are slowly depleted and must be written off (against earnings) over time. And enterprise value is more helpful than market value because it ensures debt-laden companies are valued on a truly equivalent basis versus those that use more judicious levels of debt.

Let's look at two of the hot names in the oil and gas sector. Analysts are currently recommending shares of Apache Corp (NYSE: APA(link is external)) and Anadarko Petroleum (NYSE: APC(link is external)).  Each of those energy exploration firms has an EV/EBITDA multiple of just over 5 (based on projected 2010 EBITDA) while the average EV/EBITDA multiple in their peer group is just under 7. That seems to indicate APA and APC are relatively undervalued.

But if you looked at Anadarko strictly on a P/E basis, you'd wonder why shares hold any appeal, trading at nearly 30 times projected 2010 net income.

As an investor, it's important to continually sharpen your skills and put new tools in the toolbox. And it makes sense to go through and calculate EV/EBITDA for all your current holdings. You especially want to look at how they compare to other companies in their industries. If they sport a much higher EV/EBITDA ratio (even if the P/E ratio looks more reasonable), then that might tell you it's time to sell. If the EV/EBITDA ratio is much lower, it may be time to buy some more.

With This Ratio, Cash Flows Are King

Formula for enterprise value is EV = Market Capitalization + Total Debt + Preferred Stock - Cash


If you're like most investors, you probably use the price-to-earnings ratio (P/E) to measure the value of a company. By dividing the market price by earnings, you can get an easy-to-understand measure of a firm's value and a simple way to compare different companies to each other. 

Want a better indicator than the P/E ratio?

Calculating free cash flow relative to a company's valuation can be a better way to compare your alternatives. Add free cash flow indicators to your stock evaluation tool kit.
Cash flow, and especially free cash flow, is important to valuing a company. The price-to-free cash flow ratio (P/FCF), or its inverse, the free cash flow yield, is a great indicator when you know how to use it. 

Calculating Free Cash Flow
Free cash flow alone won't help you value a company, but dividing free cash flow by company valuation gives you the free cash flow yield, and this number is an easy way to compare investment alternatives. You can use if much in the same way as you use earnings yield or dividend yield.

Fortunately, calculating the free cash flow yield is pretty straightforward. First, use the Cash flow statement to subtract capital expenditures from cash flow from operations.
Next, divide free cash flow by the value of the company, also known as its market capitalization.

The formula is Free Cash Flow Yield = Free Cash Flow / Market Capitalization.

The market cap of a publicly-traded company can be easily calculated by multiplying its share price by total shares outstanding. You can also find market capitalization pretty easily on sites like CNBC.com and Yahoo! Finance.

If you invert the calculation, it is comparable to the P/E ratio. And like the P/E ratio, the P/FCF ratio lets you compare different companies' ability to generate cash flow regardless of their size. 

What about companies that use debt, especially a lot of it, to fund their business?  If you use the company’s market capitalization to calculate your valuation ratio, you can end up with misleading information. In this case, a more sophisticated approach would be to use enterprise value (EV) as the divisor for the free cash flow yield calculation.

When a company uses a substantial amount of debt, EV offers a better measure of the value of a company because it includes the value of preferred shares, minority interest and cash.

The formula for enterprise value is EV = Market Capitalization + Total Debt + Preferred Stock - Cash

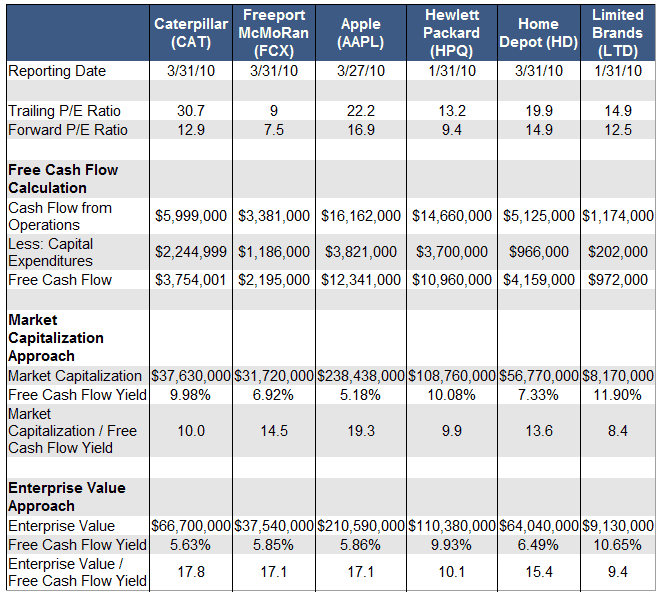
The table below shows the free cash flow calculations for six large, well-known companies from several industries.

Freeport McMoRan, a large mining company, sports a low P/E ratio, which on first analysis seems to indicate the company is a good buy. But when we calculate free cash flow, Freeport McMoRan doesn't look so good: free cash flow / free cash flow and EV / free cash flow both leap higher.

On the other hand, Limited Brands generates more free cash than one would expect by just looking at the company’s trailing and forward P/E ratios. Since cash in the bank is what we all want, it pays to look into the ability to generate cash of any company you have an interest.

Most mature companies are able to generate excess cash. Comparing free cash flow generated per market or enterprise value provides an excellent way to assess the value of several mature companies.

For growth companies who plow capital back into the business to fuel growth, there are a couple of other ways to use cash flow to assess future growth. But that is a subject another time.

Stop Pushing Water Down - Push It Back for Real

Good video on our arm movement by @oceanswimschool